
Study population
Fifty-six patients on dialysis were vaccinated and participated in the study (55 hemodialysis, 1 continuous ambulatory peritoneal dialysis). Information on patient characteristics including primary disease that led to renal failure resulting in dialysis treatment, time on dialysis, previous kidney transplantation, immunosuppressive therapy, SARS-CoV-2-related history and differential blood counts are shown in Table 1. The mean age of the patients was 69.1 ± 13.8 years (73.2% male, 26.8% female). Most patients had a history of homologous mRNA vaccination, and between three and up to seven prior immunisation events (including vaccinations and infections). A total of 43 patients (76.8%) had at least one immunisation event attributable to a previous SARS-CoV-2-infection.
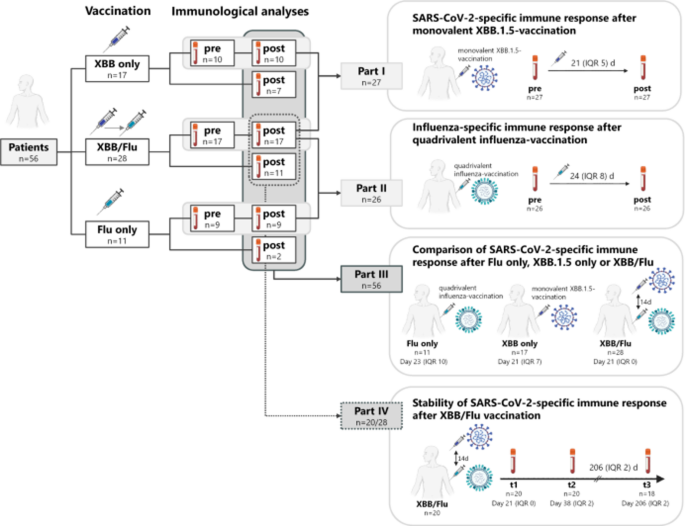
A flow-chart and the study design are illustrated in Fig. 1. All patients were vaccinated (17 (30.4%) XBB.1.5 only, 11 (19.6%) influenza (Flu) only, and 28 (50.0%) sequential XBB.1.5/Flu), and had post-vaccination immunological analyses performed. Among those, 36 patients also had baseline analyses prior to vaccination performed (10 after XBB only, 9 after Flu only, and 17 after XBB/Flu). Immunogenicity of the monovalent XBB.1.5 and influenza vaccine was analysed in those patients before and after monovalent XBB.1.5 vaccination (Fig. 1, n = 27, part I), and influenza vaccination (Fig. 1, n = 26, part II), respectively, independent of whether patients received sequential or single administration of the individual vaccines. Comparative analysis of vaccine-induced SARS-CoV-2-specific immunity in individuals after sequential vaccination (n = 28), after XBB.1.5 vaccination only (n = 17) and after influenza vaccination (n = 11) was performed in part III (Fig. 1, part III). Finally, the stability of vaccine-induced SARS-CoV-2-specific immunity was analysed up to six months after sequential XBB.1.5 and influenza vaccination (Fig. 1, n = 20, part IV). Information on patient characteristics of the individual subgroups included in parts I-part IV is shown in supplementary tables S1–S4.

Flow-chart and schematic overview of the four parts of the study. A total of 56 patients were tested after having received either the monovalent XBB.1.5 vaccination alone (“XBB only”, n = 17), influenza vaccination alone (“Flu only”, n = 11), or sequential administration of both vaccines (“XBB/Flu”, n = 28, with the influenza vaccine administered fourteen days after XBB.1.5 vaccination). Among those, 36 patients had baseline analyses performed prior to vaccination (10 before XBB only, 9 before Flu only and 17 before XBB/Flu). Part I: SARS-CoV-2-specific humoral and cellular immune responses were characterized in 27 patients before and after monovalent XBB.1.5-vaccination irrespective of influenza vaccination. Time of testing in relation to XBB.1.5 vaccination is indicated. Part II: Influenza-specific humoral and cellular immune responses were characterized in 26 patients before and after influenza vaccination irrespective of XBB.1.5 vaccination. Time of testing in relation to influenza vaccination is indicated. Part III: SARS-CoV-2-specific immune responses were compared in dialysis patients after XBB only (n = 17), Flu only (n = 11), or sequential administration of XBB.1.5 followed by influenza vaccination (n = 28; XBB/Flu). Testing was performed approximately three weeks after the XBB.1.5- or influenza vaccination as indicated in the figure. Part IV: The stability of the SARS-CoV-2-specific immune response in 20 dialysis patients after XBB/Flu who participated in the follow-up part of the study was investigated starting at 21 days after XBB.1.5 vaccination over a period of 6 months with time points indicated in the figure. Two patients were lost to follow-up (1 died, 1 was transplanted). Demographic characteristics of the subgroups are shown in supplementary tables S1–S4.
Part I: SARS-CoV-2-specific humoral and cellular immunity after monovalent XBB.1.5 vaccination
SARS-CoV-2-specific humoral and cellular immune responses after XBB.1.5 vaccination was analysed from paired samples of 27 patients immediately before and a median of 21 (IQR 5) days after vaccination (Fig. 1, part I; Fig. 2). Information on patient characteristics is shown in supplementary table S1. All patients had spike-specific IgG antibody levels above detection limit prior to vaccination (median 9743 (IQR 7983) BAU/ml, which increased to 23907 (IQR 21403) BAU/ml thereafter (p < 0.0001, Fig. 2a). Spike-specific T cells were characterized after stimulation with overlapping peptides spanning the parental spike protein and quantified flow-cytometrically based on co-expression of the activation marker CD69 and the cytokine IFNγ. In line with IgG antibodies, spike-specific CD4 and CD8 T cells increased significantly after vaccination (p = 0.006 and p = 0.0003, respectively, Fig. 2b), although spike-specific CD8 T cells showed higher interindividual variability. Differences were spike-specific, as SEB-reactive CD4 and CD8 T-cell levels did not change after vaccination (Figs. 2b). We found an inverse correlation between pre-existing spike-specific IgG and CD4 T-cell levels and the respective fold increase after vaccination (p = 0.043, Spearman r=-0.393 for IgG; p = 0.02, r=-0.416 for CD4 T cells), whereas no such correlation was observed for CD8 T cells (p = 0.181, r = 0.266).

Vaccine-induced SARS-CoV-2-specific humoral and cellular immune response in dialysis patients after monovalent XBB.1.5 vaccination. Blood samples were drawn from dialysis patients (n = 27) before and a median of 21 (IQR 5) days after monovalent XBB.1.5 vaccination. Levels of spike-specific (a) IgG antibodies towards parental spike protein, as well as spike-specific and SEB-reactive (b) CD4 and CD8 T cells were analysed. Highlighted symbols represent medians. Differences were calculated using the Wilcoxon signed rank test. Abbreviations: BAU, binding antibody unit; IFN, interferon; Ig, immunoglobulin; IQR, interquartile range; SEB, Staphylococcus aureus Enterotoxin B.
To analyse potential differences in CD4 and CD8 T-cell levels toward spike from the parental strain and Omicron variant XBB.1.5, blood samples from a subset of patients after vaccination were also stimulated with peptide pools derived from XBB.1.5 spike. As shown in supplementary figure S1, the percentages of XBB.1.5-spike specific CD4 and CD8 T-cell levels did not differ from the respective T-cell frequencies against parental spike, indicating substantial T-cell cross reactivity between the strains.
Further phenotypical and functional characteristics of spike-specific T cells were analysed by co-expression of IFNγ, IL-2 and TNF after Boolean gating. This allowed distinction of seven subpopulations including polyfunctional cells simultaneously expressing all three cytokines, two cytokines, or one cytokine only. Both before and after vaccination, spike-specific CD4 T cells were predominantly polyfunctional, followed by CD4 T cells expressing TNF alone or in combination with IFNγ or IL-2 (Fig. 3a). Cytokine profiles of spike-specific CD4 T cells differed from those of spike-specific CD8 T cells. As expected, CD8 T cells produced less IL-2, and were primarily IFNγ+TNF+ (Fig. 3b). Furthermore, expression levels of CTLA-4 as an immunological regulatory marker and as an indicator of a recent antigen exposure were analyzed (Fig. 3c and d). Median CTLA-4 expression levels showed a significant increase on both spike-specific CD4 (p = 0.0004) and CD8 T cells (p = 0.005) after vaccination. Likewise, CTLA-4 expression on both vaccine-induced spike-specific CD4 T cells and CD8 T cells were significantly higher compared to SEB-reactive T cells (Fig. 3c and d). Of note, despite low sample size, even baseline levels of CTLA-4 were higher on spike-reactive CD8 T cells than on respective SEB-reactive T cells which may result from a more recent immunological challenge with SARS-CoV-2 antigens.

Functional and phenotypical characterization of parental spike-specific CD4 and CD8 T cells in dialysis patients before and after monovalent XBB.1.5 vaccination. Cytokine expression profiles of (a) CD4 and (b) CD8 T cells after stimulation with parental spike protein or Staphylococcus aureus Enterotoxin B (SEB) were compared in patients before and after XBB.1.5 vaccination. At the single-cell level, the cytokine-expressing T cells were differentiated into 7 subpopulations according to their expression of IFNγ, TNF and IL-2 (single, double or triple cytokine-expressing cells). All samples were analysed but only samples of patients with at least 30 cytokine-expressing CD4 and CD8 T cells were included, respectively, to allow for robust statistical analysis (datasets indicated in the figures). Bars represent means and standard deviations of subpopulations. Differences were determined using the unpaired t-test. Median fluorescence intensity (MFI) of CTLA-4 expression on spike-specific and SEB-reactive (c) CD4 and (d) CD8 T cells was compared. All samples were analysed, but to allow robust statistical analysis, only samples with at least 20 cytokine-positive CD4 and CD8 T cells, respectively, were included (datasets indicated in the figures). Horizontal bars refer to the median values with interquartile range. Differences between groups were analysed using the Mann Whitney test. Differences remain significant if only paired datasets are considered. Abbreviations: CTLA-4, cytotoxic T-lymphocyte-associated protein 4; IFN, interferon; IL, interleukin; RG, reference group; SEB, Staphylococcus aureus Enterotoxin B; TNF, tumor necrosis factor.
Part II: Influenza-specific humoral and cellular immunity after quadrivalent influenza vaccination
The induction of influenza-specific humoral and cellular immune response after influenza vaccination was analysed from paired samples for twenty-six patients immediately before and a median of 24 (IQR 8) days after vaccination (Fig. 1, part II; Fig. 4). Information on patient characteristics of this subgroup is shown in supplementary table S2. Antibody titers directed against the two influenza A and the two influenza B components of the vaccine were examined separately. Levels of IgG antibodies toward influenza A (p = 0.007) and B (p = 0.004) significantly increased after vaccination (Fig. 4a). Levels of IgA antibodies toward influenza A also increased (p = 0.001), whereas the increase in IgA levels towards influenza B did not reach statistical significance (p = 0.084, Fig. 4a). Influenza-specific T cells were characterized after stimulation with the tetravalent influenza vaccine. Influenza-specific CD4 T-cell levels showed a significant increase (p < 0.0001, Fig. 4b). In contrast, influenza-specific CD8 T-cell levels were not induced after vaccination (p = 0.722, Fig. 4b). We do not have any evidence for differences in the two different quadrivalent vaccines used (supplementary figure S2). Finally, SEB-reactive CD4 or CD8 T-cell levels did not change after vaccination (Fig. 4b).

Vaccine-induced Influenza-specific humoral and cellular immunity in dialysis patients before and after quadrivalent influenza vaccination. Blood samples were drawn from dialysis patients (n = 26) before and a median of 24 (IQR) 8 days after influenza vaccination (n = 21 Influsplit Tetra, n = 5 Efluelda). Levels of specific (a) IgG and IgA antibodies towards influenza A and B, as well as (b) influenza-specific and SEB-reactive CD4 and CD8 T cells were analysed. Not all patients had pre-vaccination T-cell analyses performed with tested individuals indicated in the figures. Highlighted symbols represent medians. Differences were calculated using the the Wilcoxon signed rank test. Stratified analyses of data between patients who had received Influsplit and Efluelda are shown in supplementary figure S2. (c) Cytokine expression profiles of influenza-specific CD4 T cells were compared before and after vaccination. At the single-cell level, the cytokine-expressing T cells were differentiated into 7 subpopulations according to their expression of IFNγ, TNF and IL-2 (single, double or triple cytokine-expressing cells). All samples were analysed but only samples of patients with at least 30 cytokine-expressing CD4 and CD8 T cells were included, respectively, to allow for robust statistical analysis (datasets indicated in the figures). Bars represent means and standard deviations of subpopulations. Differences were determined using the unpaired t-test. (d) Median fluorescence intensity (MFI) of CTLA-4 expression on influenza-specific and SEB-reactive CD4 T cells was compared. All samples were analysed, but to allow robust statistical analysis, only samples with at least 20 cytokine-positive CD4 and CD8 T cells, respectively, were included (datasets indicated in the figures). Horizontal bars refer to the median values with interquartile range. Differences between groups were analysed using the Mann Whitney test. Differences remain significant if only paired datasets are considered. Abbreviations: CTLA-4, cytotoxic T-lymphocyte-associated protein 4; IFN, interferon; IL, interleukin; RG, reference group; SEB, Staphylococcus aureus Enterotoxin B; TNF, tumor necrosis factor.
Functional analysis showed that influenza-specific CD4 T cells were mostly polyfunctional, followed by double-positive cells co-expressing either TNF/IFNγ or TNF/IL-2 (Fig. 4c). Similar as with spike-specific CD4 T-cell characteristics, the cytokine profile after vaccination showed a decrease in polyfunctional T cells with a concomitant shift toward higher expression of double-cytokine producing populations. Again, expression of CTLA-4 on influenza-specific CD4 T cells increased significantly after vaccination (Fig. 4d), and reached higher levels than respective SEB-reactive CD4 T cells. In contrast, baseline levels of CTLA-4 on influenza-reactive CD4 T cells were similar as on SEB-reactive T cells.
Part III: Influence of a sequential influenza vaccination on XBB.1.5-vaccine-induced SARS-CoV-2-specific humoral and cellular immune responses
A potential influence of a sequential influenza vaccination on the XBB.1.5-induced immune response was investigated by comparing spike-specific immunity of 28 patients who had analyses performed after sequential vaccination (XBB/Flu) with respective data of 17 patients receiving XBB.1.5 vaccine alone (“XBB only”) and of 11 patients receiving influenza vaccine alone (“Flu only”, Fig. 1, part III; Fig. 5). Information on patient characteristics of these subgroups are shown in supplementary table S3. Despite sequential influenza vaccination after XBB.1.5, patients reached median levels of spike-specific IgG of 4981 BAU/ml (IQR 5521 BAU/ml) of similar magnitude as in patients after XBB.1.5 only (4641 BAU/ml (IQR 4407 BAU/ml)), which expectedly were significantly higher than in patients after Flu only vaccination (726 BAU/ml (IQR 1897 BAU/ml), p = 0.0005, Fig. 5a). As with IgG, spike-specific CD4 T-cell levels showed significant differences between the groups (p = 0.003), and were highest in patients receiving the XBB.1.5 vaccine followed by the influenza vaccine (p = 0.002, Fig. 5b), with no significant difference between patients after XBB.1.5 vaccination alone (0.16% (IQR 0.16%)) and sequential vaccination (0.22% (IQR 0.30%), p = 0.659). Despite some trend toward numerically highest levels of spike-specific CD8 T cells in the XBB/Flu vaccine group, the differences between the groups did not reach statistical significance (p = 0.332, Fig. 5c). Differences in CD4 T cells were spike-specific, as global T-cell activation capacity after SEB-stimulation were similar in the three groups (Fig. 5b and c). Baseline levels of specific antibodies and T cells tested prior to vaccination did not differ between the three groups, although there was a trend towards lower values in the Flu only group (supplementary figure S3).

Comparison of vaccine-induced spike-specific humoral and cellular immunity in dialysis patients after sequential, monovalent XBB.1.5 alone or quadrivalent influenza vaccination alone. Blood samples were drawn from dialysis patients at a median of 23 (IQR 10) days after quadrivalent influenza vaccination (Flu only, n = 11), at a median of 21 (IQR 7) days after monovalent XBB.1.5 vaccination alone (XBB only, n = 17) or at a median of 21 (IQR 0) days after sequential XBB1.5 + Flu vaccination (XBB/Flu, n = 28, quadrivalent influenza vaccine was administered fourteen days later than XBB.1.5 vaccine). Levels of (a) spike-specific IgG antibodies, as well as (b) CD4 and (c) CD8 T cells after stimulation with peptides toward the parental spike protein or Staphylococcus aureus enterotoxin B (SEB) were compared between the three groups. Two patients, marked by a black triangle, had a previous SARS-CoV-2 infection 20 and 56 days before administration of the influenza vaccine, respectively. Bars represent medians with interquartile ranges. Differences between groups were analysed using Kruskal-Wallis test followed by Dunn’s post test. Abbreviations: BAU, binding antibody unit; Flu, influenza, IFN, interferon; Ig, immunoglobulin.
It is interesting to note that the highest spike-specific CD4 and CD8 T-cell levels in the Flu only group were observed in two patients with a history of recent SARS-CoV-2 infection (20 and 56 days before administration of the influenza vaccine, respectively, marked by a triangle, Fig. 4). Their median CD4 and CD8 T-cell levels were in a similar or even higher range as with those of the XBB.1.5 vaccine groups. The IgG titers of these two patients differed, with the higher titer observed in the patient with the shorter time from infection (28431.54 BAU/ml vs. 653.95 BAU/ml).
We finally applied multivariable linear regression analysis adjusted for age, sex, and prior infection, which confirmed differences in vaccine-induced IgG and CD4 T-cell levels between the three regimens, with lowest levels in patients after Flu only vaccination (supplementary table S5). Moreover, IgG were also confounded by sex, whereas prior infection had no confounding effect on any of the parameter.
Part IV: Stability of spike-specific immune responses after sequential XBB.1.5 + Flu vaccination
Starting from 21 (IQR 0) days after XBB.1.5 vaccination, we finally analysed the stability of the vaccine-induced spike-specific immune response two times over a 6-month time period among 20/28 patients who had received sequential XBB.1.5 + Flu vaccination (t1/t2, n = 20; t3, n = 18, Fig. 1, part IV; Fig. 6a). Information on patient characteristics of these subgroups are shown in supplementary table S4.

Stability of spike-specific immune responses after sequential XBB.1.5 + Flu vaccination over six months. (a) Schematic outline of the study design. Blood samples were drawn from a subgroup of 20 dialysis patients receiving the monovalent XBB.1.5 vaccine followed by the quadrivalent influenza vaccine fourteen days later (XBB/Flu), who consented to participate in the follow-up part of the study. Time points (t1-t3) for blood sampling refer to the XBB.1.5 vaccination, starting 21 (IQR 0) days after vaccination. During the 6-month period, one female patient in her late seventies died (secondary chronic renal disease, 6 years on dialysis), and one male patient in his sixties received a transplant (secondary chronic renal disease, 2.4 years on dialysis) 105 and 91 days after XBB.1.5 and influenza vaccination, respectively. Levels of (b) spike-specific IgG antibodies, (c) CD4 and CD8 T cells after stimulation with peptides toward the parental spike protein or Staphylococcus aureus enterotoxin B (SEB) were compared between the three different time points (d) Cytokine-expression profiles of CD4 and CD8 T cells after stimulation with parental spike protein or SEB were compared between the three different time points. Only samples of the patients with at least 30 cytokine-expressing CD4 or CD8 T cells were included, respectively, to allow for robust statistical analysis (datasets indicated in the figures). (e) Median fluorescence intensity (MFI) of CTLA-4 expression on spike-specific and SEB-reactive CD4 and CD8 T cells from patients after sequential vaccination was determined. To allow robust statistical analysis, only samples with at least 20 cytokine-positive CD4 and CD8 T cells, respectively, were included. Bars represent (b, c, e) medians with interquartile ranges or (d) means and standard deviations for cytokine-subpopulations. Fold changes are indicated above the graphs and were calculated by dividing the individual levels after vaccination and levels prior to vaccination. Paired analysis between time points were analysed using Wilcoxon-signed rank test. Abbreviations: CTLA-4, cytotoxic T-lymphocyte-associated protein 4; IFN, interferon; Ig, immunoglobulin; IL, interleukin; IQR, interquartile range; SEB, Staphylococcus aureus Enterotoxin B; TNF, tumor necrosis factor.
Compared to vaccine-induced immunity after 21 days (t1), spike-specific IgG levels decreased 0.86-fold by day 38. This level further decreased 0.57-fold and reached statistical significance by 6 months after vaccination (p = 0.008, Fig. 6b). Likewise, median percentages of spike-specific CD4 T cells showed a significant decrease after 38 days (t2, 0.74-fold, p = 0.002), but remained largely stable subsequently (p = 0.462, Fig. 6c). Spike-specific CD8 T-cell levels remained rather stable early after vaccination (t2, 0.91-fold, p = 0.182), and decreased significantly by 6 months (t3, 0.61-fold, p = 0.009, Fig. 6c). In general, no pronounced dynamic changes were observed among SEB-reactive CD4 or CD8 T-cell frequencies over time. Regarding functional and phenotypical characteristics, the overall cytokine expression profiles of spike-specific CD4 and CD8 T cells largely remained stable with some trend in increasing polyfunctionality over time (Fig. 6d). As expected, CTLA-4 expression on spike-specific CD4 and CD8 T cells was numerically highest early after vaccination, and decreased over the 6-month period from a median of 3345 (IQR 5070) to 604 (IQR 1005) on CD4 T cells, and from 963.5 (IQR 3312.7) to 516 (IQR 1596) on CD8 T cells after 38 days post-vaccination, with no further decrease by 6 months (0.94-fold, p = 0.375, Fig. 6e). Despite some decrease in spike-specific immunity over a period of six months, levels of IgG antibodies and CD4 T cells remained significantly higher in patients receiving the XBB.1.5 vaccine as compared to a subgroup of 23 patients without XBB.1.5 vaccination, who were recruited in the same time period (Table 2). An exception were spike-specific CD8 T cells which did not differ between the two groups (Table 2).