
Construct design and cloning
Protein constructs were based on DtxR (residues 2–121 with a C102D mutation based on PDB 1F5T (ref. 48), UniProt Acc. No. P0DJL7), GemininCoiled-Coil (residues 110–145 with an additional N-terminal threonine and C-terminal glutamine based on PDB 1T6F (ref. 49), UniProt Acc. No. E2QRF9), TrpR (residues 2–10 based on PDB 1TRO (ref. 50), UniProt Acc. No. P0A881), MetJ (residues 2–105 with a Q45K mutation based on PDB 1MJM (refs. 51,52), UniProt Acc. No. P0A8U6) and the SpyTag:SpyCatcher system53.
Both MetJ and TrpR were expressed from pET28a vectors as fusion proteins with an N-terminal 8x His-tag. DtxR was expressed from a pET19b vector as a fusion protein with a C-terminal 6x His-tag.
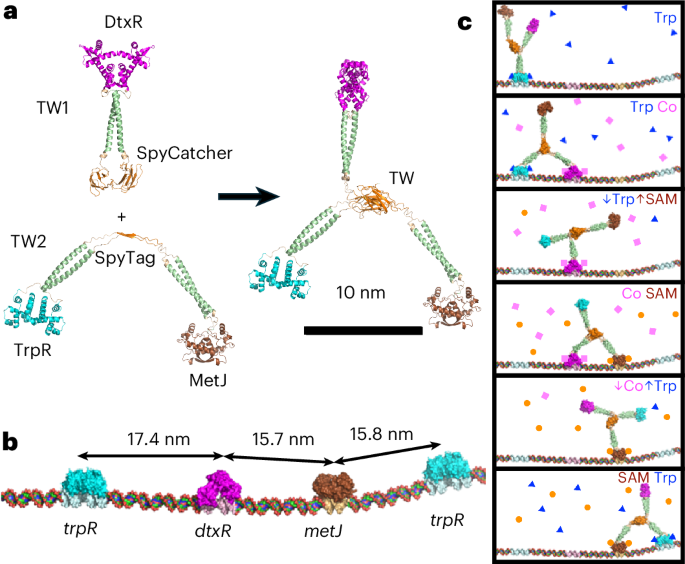
TW was produced from two separate constructs, TW1 and TW2 (Fig. 1a and Supplementary Fig. 8). TW1 consists of DtxR-GemininCoiled-Coil-SpyCatcher. TW2 consists of TrpR-GemininCoiled-Coil-SpyTag-GemininCoiledCoil-MetJ. For both TW1 and TW2, the domains were connected using glycine–serine-rich linkers. Both TW1 and TW2 constructs were synthesized by Genescript within a pET15b vector allowing protein expression with an N-terminal 8x His-tag and TEV protease cleavage site.
Protein expression and purification
All proteins were expressed in E. coli (repressors and TW1 using BL21 in LB; TW2 using C41 in 2xTY media). Cells were grown at 37 °C until OD600 = 0.6, where temperature was reduced to 24 °C and expression induced using 0.4 mM IPTG. After 20 h, cells were collected by centrifugation and pellets stored at –80 °C.
Cell pellets were resuspended at 4 °C with stirring in 20 mM Tris pH 8, 150 mM NaCl, 20 mM imidazole, 10% glycerol, 2.5 mM MgCl2, 0.5 mM CaCl2, 1 mM NaN3, 0.1 mg ml−1 lysozyme, 10 µg ml−1 DNase I and 1 x protease tablet (Sigma-Aldrich). The slurry was lysed using a cell disruptor at 20 kPSI pressure. The soluble fraction was collected by centrifugation by 50,000 × g and loaded onto a 5 ml HisTrap HP nickel affinity chromatography column (Cytiva). The column was washed using combinations of buffer A (20 mM Tris pH 8, 400 mM NaCl, 10% glycerol, 1 mM NaN3) and buffer B (buffer A + 1 M imidazole): first with 2% buffer B, then 5% buffer B and then finally an elution step with 30% buffer B. Eluted proteins were concentrated and diluted to a final concentration of 3% buffer B, then subjected to an overnight TEV protease cleavage (1:50 mg mg−1 TEV:protein), with 1 mM DTT. The TEV-cleaved sample was then flowed over the HisTrap column to remove contaminants.
All proteins were subjected to SEC using either a HiLoad Superdex 75 26/60 column for individual repressors or a HiLoad 200 16/600 column for TW1 and TW2 (Cytiva). SEC was performed in 20 mM Tris pH 8, 400 mM NaCl, 10% glycerol, 1 mM NaN3 and 1 mM EDTA. Protein yields were typically 1 mg l−1 for individual repressors, 4 mg l−1 for TW1 and 0.3 mg l−1 for TW2. Purified protein was then frozen using liquid nitrogen and stored at –80 °C.
Assembly and purification of TW
Purified TW1 and TW2 were mixed with a molar ratio of 1.2:1 (with TW2 at a final concentration of 20–40 µM) in 20 mM Tris pH 8, 400 mM NaCl, 10% glycerol, 1 mM NaN3 and 1 mM EDTA at 4 °C for 16 h. Assembled TW was purified by SEC using a Superdex 200 Increase 10/300 column (Cytiva), using assembly buffer. TW was then frozen in liquid nitrogen and stored at –80 °C.
Fluorescent labelling of TW
Fluorescent TW was produced by thiol conjugation of a maleimide dye to TW containing a cysteine mutation. TW2 construct containing TrpR-S107C (TW2-S107C) was synthesized by Genscript. The protein was expressed and purified as described above, with 1 mM DTT included in purification buffers.
Alexa Fluor 488 C5 maleimide (AF488; ThermoFisher Scientific) was resuspended to 10 mM in DMSO. Purified TW2-S107C was reduced with 1 mM TCEP pH 7 before labelling at a final concentration of 30–60 µM with 5–10× molar excess of maleimide dye. Reactions were performed in 50 mM Tris pH 8, 400 mM NaCl and 10% (v/v) glycerol either for 2 h at room temperature or overnight at 4 °C. Reactions were quenched with 50 mM DTT for 30 min at room temperature. Labelled TW was assembled and purified as described above.
Following removal of excess dye, the degree of protein labelling was measured using an ND-1000 NanoDrop spectrophotometer (ThermoFisher Scientific). The absorbance of the protein:dye conjugate was measured at 280 nm (protein) and at 495 nm (AF488) (Supplementary Table 2). The degree of labelling was calculated according to the equation54
$${\mathrm{Degree}}\,{\mathrm{of}}\,{\mathrm{labelling}}=\frac{{\varepsilon }_{{\mathrm{Protein}}}\times {{\mathrm{A}}}_{495}}{({{\mathrm{A}}}_{280}{-{\mathrm{CF}}}_{280}{\times {\mathrm{A}}}_{495})\times {\varepsilon }_{{\mathrm{Dye}}}}.$$
(1)
Here \({\varepsilon }_{{\mathrm{Protein}}}\) is the extinction coefficient of the protein at 280 nm (55,350 M−1 cm−1), \({\varepsilon }_{{\mathrm{Dye}}}\) is the extinction coefficient of AF488 at 495 nm (73,000 M−1 cm−1) and CF280 is the correction factor for the absorption of light at 280 nm by AF488 (0.11). TW was assessed to be >95% labelled (two labels per dimeric TrpR foot), frozen with liquid nitrogen and stored at −80 °C.
SAXS data collection
SAXS data were collected on the small/wide angle X-ray scattering beamline at the Australian Synchrotron55. The camera length was 2,680 mm corresponding to a q-range of 0.005–0.50 Å−1. Proteins were auto-loaded from a 96-well plate and 50 ml of 10 mg ml−1 of sample injected onto a Superdex 200 Increase 5/150 GL equilibrated in 10 mM HEPES pH 7.4, 150 mM NaCl and 5 mM MgCl2, connected in line with a coflow cell56 through which X-rays were passed at 8 × 10¹² photons per second at 11.5 keV. The data was collected on a Pilatus 2M detector (Supplementary Table 4).
SAXS data processing
SAXS data were processed using the ATSAS suite57,58 (Supplementary Table 4). Protein elution profiles were generated from scattering intensities using custom scripts. The elution profiles were used to determine the signals corresponding to protein and buffer frames. First, 21 buffer frames were selected and averaged for background subtraction. The radius of gyration (Rg) was then determined for each frame across the protein peak (after buffer subtraction). Guinier analysis to determine Rg was performed in PRIMUS57 to monitor data quality. Distance distribution (P(r)) curves (Supplementary Fig. 1) were generated using GNOM57 to estimate the maximum dimension (Dmax) of the protein.
Multi-state modelling with MultiFoXS
Multi-state modelling using MultiFoXS24 was used to determine the population-weighted conformational states of TW. The inputs to MultiFoXS included a TW model, SAXS profile, flexible hinge residues and rigid body connections. Models of TW1 and TW2 were generated using ColabFold v1.4: AlphaFold2 using MMseqs259 and used to construct a complete model for TW assembly using UCSF Chimera60. For MultiFoXS, TW was divided into rigid elements and hinge regions. The rigid elements comprise three repressor dimers, three coiled-coils and SpyTag/SpyCatcher hub. Six hinges were placed in Gly-Ser-rich linkers. To simplify computation, the polypeptide chain was cut in one of the two Gly-Ser-rich linkers joining each rigid element. Thus, the six hinges were defined as TW1, Gly125-Gly126 and Gly170-Gly171, between DtxR, the coiled-coil and SpyCatcher, respectively; and TW2, Ser114-Gly115, Ser155-Ser156, Gly183-Ser184 and Gly228-Gly229, between TrpR, the coiled-coil, SpyTag, coiled-coil and MetJ, respectively (Supplementary Fig. 8).
Final calculations were performed to sample 10,000 conformations. For each sampled conformation, a SAXS profile is calculated followed by scoring of multi-state models to generate population-weighted ensembles with associated Rg. The best multi-state models that fit the experimental SAXS data were based on the χ2 values and residual plots.
Design and assembly of DNA tracks
The metJ cognate sequence (GAGACGTCTC) is the consensus Met box sequence from the MetJ:DNA crystal structure (PDB 1MJM)51. The trpR cognate sequence (GTACTCGCTAGCGAGTAC) was based on a trpRS sequence that binds TrpR dimer with 1:1 stoichiometry61. The dtxR cognate sequence (TTAGGTTAACCTAA) was based on a DtxR:DNA crystal structure (PDB 1F5T)48, with the sequence altered to produce a palindrome that is capable of binding only one DtxR dimer.
The metJ flanking sequences were based on native E. coli metC protomer sequence (GenBank Ref. Seq. NC_000913.3) containing a single Met box51. The dtxR flanking sequences were conserved from the DtxR:DNA crystal structure (PDB 1F5T)48. The trpR flanking sequences were designed by a genetic algorithm to minimize the presence of cryptic repressor binding sites26. Double and quadruple site tracks were designed by arranging cognate sites and their flanking sequences. Models of the tracks were produced using cgNA+web62,63 and analysed using PyMOL64 to ensure that the cognate sites were appropriately separated and in phase.
All tracks were assembled from single strand oligonucleotides from Integrated DNA Technologies (IDT). Oligonucleotides were resuspended to 100 µM in Milli-Q water (Millipore) and stored at –20 °C.
Single- and double-site oligonucleotides were annealed at concentrations of up to 40 µM in 25 mM HEPES pH 7.4, 200 mM KCl, 5 mM MgCl2 in a thermocycler by heating the sample to 95 °C for 2 min followed by a 95–20 °C gradient at 1 °C min−1. Annealed tracks were stored at −20 °C. Supplementary Table 5 lists all DNA tracks used in SPR and mass photometry experiments.
Oligonucleotides for the four-site track used in single-molecule experiments are listed in Supplementary Table 6. Oligonucleotides required for the track were mixed at concentrations of 11.4 µM of each component in 1.25× T4 polynucleotide kinase (PNK) reaction buffer (New England BioLabs, catalogue number B0201S) and annealed as described above. The annealed four-site track was ligated by adding ATP (New England BioLabs, catalogue number P0756S) to a final concentration of 1 mM and T4 DNA ligase (New England BioLabs, catalogue number M0202S) to a final concentration of 10,000 U ml−1. The resulting ligation reaction mixture in 1× PNK was incubated at 16 °C for 16 h before heat inactivation at 65 °C for 10 min. DNA was purified using a spin column (QIAquick PCR Purification Kit, Qiagen) as per the manufacturer’s instructions. Purified tracks were stored at 4 °C.
AFM
E. coli containing the pK8 plasmid26 were cultured in LB overnight in the presence of 25 mg ml−1 kanamycin, then pelleted by centrifugation for 3 min at 12,000 rpm and the plasmid purified using a MiniPrep kit (Qiagen). DNA was linearized by digestion with 1 U EagI per 150 ng DNA in NEBBuffer 3 for 2 h at 25 °C, followed by heat inactivation at 65 °C for 25 min. The product was purified using a PCR Cleanup kit (Qiagen) and digestion confirmed by gel electrophoresis.
TW (0.26 mg ml−1) and 10X HEPES buffer (40 mM HEPES, 100 mM NaCl, 20 mM MgCl2, pH 7.4) were both diluted fivefold in Milli-Q water (1:1:3 TW:10X HEPES:H2O). This stock (2.5 µl) was placed into a pre-lubricated microcentrifuge tube, to which was added 1.25 µl of linearized DNA (69.3 ng ml−1) and 1.25 µl of 40 mM tryptophan and incubated at room temperature on a spinner for 1 h. Afterwards, 45 µl of 1X HEPES buffer was added to the incubated solution, mixed and plated immediately onto freshly cleaved mica, where it was allowed to sit for 4 min. Excess solution was then shaken off, and the plate rinsed 5 times with 1 ml of Milli-Q water, then dried gently using filtered compressed air.
AFM images were recorded using an Asylum Research MFP-3D SPM, using Mikromasch HQ:NSC15/AL BS probes with a spring constant of 40 N m−1 and a resonance frequency of 325 kHz.
The chain-tracing software SmarTrace65 was used to determine the contour lengths of DNA flanking the bound TW proteins. For this analysis, N = 5 images were chosen that included seven or eight TW bound to clearly define the inserted track cassette. The cassette is located asymmetrically within the linearized plasmid, and thus the long and short contour lengths, and their ratio of lengths, confirmed that TWs were bound in the expected region of the DNA.
SPR
SPR experiments were performed on a Biacore S200 instrument (Cytiva). All experiments were performed in running buffer (25 mM HEPES, pH 7.4, 200 mM KCl, 5 mM MgCl2, 0.2 mM EDTA, 0.05% (v/v) Tween-20), which was passed through a 0.22 µm filter and degassed by vacuum for at least 30 min. Data were collected at 40 Hz in multi-detection mode at 25 °C. All sensorgrams were double referenced.
DNA coating of SPR chips was prepared as previously described66. Series S CM5 sensor chips (Cytiva) were prepared by depositing approximately 5,000 RU of streptavidin onto the chip surface via amine coupling. A biotinylated single-stranded oligonucleotide (biotin anchor) was added to the chip for a response of 50–70 RU. Finally, annealed single or double cognate site DNA containing a single-stranded overhang complementary to the biotin anchor was flowed over the non-reference channels for a response of approximately 10 RU. Chips were regenerated using injections of 10 mM glycine pH 2.5, removing annealed DNA and while retaining the biotin anchor on the chip.
Individual repressors and TW were titrated onto single- and double-site DNA at 100 µl min−1. When required, ligands were used with the following concentrations: 1 mM SAM, 0.4 mM CoCl2 and 0.5 mM Trp. All titrations were performed using the A–B–A injection method, with a 30 s initial ligand injection, a contact injection containing protein for 15–30 s and a final ligand injection of 40–60 s to trigger dissociation. A 60 s injection of buffer containing 0.5 M KCl was used to remove any residual protein from the surface before the next titration point. The average steady-state positions were determined by the Biacore Evaluation software (Cytiva) and fit to a Hill equation using Prism 10 (GraphPad):
$${\mathrm{RU}}=\frac{{\mathrm{RU}}_{\mathrm{Max}}\times {\left[{\mathrm{Protein}}\right]}^{h}}{{{K}_{{\mathrm{d}}}}^{h}+{\left[\mathrm{Protein}\right]}^{h}}.$$
(2)
Here Kd is the apparent affinity, h is the Hill coefficient and RUMax is the fitted maximum binding response.
We were unable to fit the above titrations to a simple 1:1 kinetic model. Increasing the amount of DNA on the chip surface leads to sensorgrams with slower apparent binding kinetics, indicating that the system suffered from mass transfer effects67. Protein:DNA interactions are particularly prone to mass transfer in SPR as electrostatically steered interactions lead to high association rates68. As a consequence, during the dissociation phase, the protein can release and rebind to the surface before it enters the bulk solution, resulting in a slower apparent dissociation rate68,69.
To avoid these complications, we studied TW:DNA dissociation kinetics using an SPR-based displacement assay based on classical tracer experiments70,71. A dual injection method was used to first load TW onto the surface DNA with an immediate second injection used to trigger dissociation. The assay was performed using a 100 µl min−1 flow rate. For single-site DNA experiments, a 5 nM TW solution was used to bind TW to DNA on the SPR chip for 25 s. Dissociation of the TW:DNA complex was triggered with an immediate 60 s injection of a solution containing 1 µM free DNA in solution ± ligand. The free DNA contained the relevant cognate binding site but lacked the anchor overhang to bind the sensor chip, hence preventing TW from rebinding chip-bound DNA. For experiments involving double-site DNA, 1 nM TW was loaded onto the DNA in the presence of two ligands for 60 s before dissociation was triggered with a 60 s injection of a solution containing both ligands and 1 μM of each of the relevant free DNA sequences. The resulting dissociation curves were fit to a single exponential decay function using Prism (GraphPad):
$${\mathrm{RU}}=\left({\mathrm{RU}}_{\mathrm{Initial}}-{\mathrm{RU}}_{\mathrm{NS}}\right)\times {{\mathrm{e}}}^{-{k}_{\mathrm{off}}\times t}+{\mathrm{RU}}_{\mathrm{NS}}.$$
(3)
Here RUInitial is the initial response value, RUNS is the non-specific response value, and koff is the apparent dissociation rate constant. For double-site DNA, double-ligand experiments, RUNS was set to 0.
Mass photometry
Mass photometry experiments were performed as described72 on an Refeyn TwoMP instrument using 24 × 50 mm high-precision 1.5H coverslips (Marienfeld) and CultureWell gaskets (Grace Biolabs). Coverslips were prepared by 3 rounds of sonication in a 50% (w/w) isopropanol bath for 3 min followed by 3 min sonication in Milli-Q water, before being dried with nitrogen gas and stored at room temperature. Gaskets were affixed to the coverslip immediately before use.
Buffers (25 mM HEPES, pH 7.4, 200 mM KCl, 5 mM MgCl2, and 0.2 mM EDTA ± 0.5 mM SAM, 0.4 mM CoCl2 and/or 0.5 mM Trp) were passed through a 0.22 µm filter. Data were collected over a 60 s timeframe using the normal measurement mode and regular image size as set by the Refeyn AcquireMP software. Mass calibrations were performed using a combination of purified bovine serum albumin (Sigma-Aldrich) and NativeMark unstained protein standard ladder (ThermoFisher Scientific), with the 66 kDa, 132 kDa and 480 kDa peaks providing a calibration curve with R2 > 0.99. Manually picked mass distributions within the relevant mass ranges were selected and fit with a Gaussian function to determine an average molecular mass using the Refeyn DiscoverMP software. Signal interference by the ligand, SAM, resulted in a small peak around 50 kDa. Such false-positive peaks from molecules below the detection limit of mass photometry have been reported previously73. DNA transiently interacted with the glass surface in the presence of CoCl2, resulting in an additional mass peak centred around 60–80 kDa.
TW1, TW2 and TW samples were added to slides to a final concentration of 10 nM. TW and 4–10-fold molar excess DNA were preincubated for 5 min before analysis on the mass photometer. Final concentrations of 25–30 nM TW and 250–300 nM DNA were used for single-site DNA experiments, whereas double-site DNA experiments used 5–25 nM TW and 50–250 nM DNA.
Microfluidics for single-molecule observation
To switch the TW running solutions, a microfluidic device, developed by Niman et al.30, was used (Extended Data Fig. 4). This device allowed switching between three solutions in arbitrary order, with sub-second time resolution, without stopping the flow. Flow rates were controlled using Fluigent lineup pumps, flow unit and OxyGEN software (Fluigent). Flow rates of 7 µl min−1 in the ‘on’ channel and 1 µl min−1 in the ‘off’ channels provided good switching (Extended Data Fig. 4c).
The chemical switching time where TW is located depends on the fluid speed and TWs location along the microfluidic channel30. Observations were conducted in the main observation channel, approximately 1 mm away from the intersection with inlet lines. A 3D finite element simulation (incompressible, laminar flow) of the volumetric flow rates in the device was performed using COMSOL Multiphysics software with the fluid set as water, with a density of 1,000 kg m−3 and a dynamic viscosity of 0.001 Pa s. For inlet flow rates of 7 µl min−1, 1 µl min−1 and 1 µl min−1, the simulated flow rate in the observation channel of 2.285 µl min−1 corresponded to a fluid speed of 7.6 mm s−1. On the basis of previous results30 (Extended Data Fig. 4), we expect that the chemical switching time in the experiments reported here at about 0.2 s or less, much faster than the 7 s during which each solution was held constant.
Microfluidic master mould fabrication protocol
To make the master mould for the microfluidics, a photomask was fabricated using an MLA150 maskless lithography system (Heidelberg Instruments). A 4″ silicon wafer was dried at 180 °C for 5 min. A 50-µm-thick dry film resist (SUEX, K50, DJ Microlaminates) was applied using a laminating machine (Catena 35, Acco UK) at 65 °C. A pre-exposure bake was performed at 85 °C on a hotplate (Model 1000-1 Precision Hot Plate, Electronic Micro Systems) to remove air bubbles and to relax the film. The SUEX film was exposed at 365 nm in a contact mask aligner (Karl Suss MJB4 soft UV) for 27 s at a lamp power of 30 mW cm−2. Post exposure baking was done at 85 °C for 5 min. Development was done in Mr DEV 600 (Micro Resist Technology) for 15 min plus 5 min in fresh developer followed by rinsing in flowing isopropyl alcohol (IPA) and drying with nitrogen. A final bake was done in a convection oven at 200 °C for 15 min. To reduce adhesion of PDMS to the master, a layer of aluminium oxide (~1 nm) followed by a monolayer of perfluorodecyltrichlorosilane (FDTS) was deposited in an atomic layer deposition system (Fiji – Plasma Enhanced ALD, Veeco).
Microfluidic device preparation and single-molecule observation
Coverslips (40 mm × 20 mm, #1.5 thickness, VWR) were prepared by sonicating in IPA (Merck) for 10 min and dried with pressurized nitrogen, followed by cleaning with piranha solution (3:1 sulfuric acid/hydrogen peroxide) for 30 min at 80 °C. Coverslips were then rinsed with Milli-Q water and dried with pressurized nitrogen. Final cleaning was performed in oxygen–nitrogen mixed plasma (Zepto Plasma Cleaner, Diener Electronic) for 3 min at 40 kHz, 100 W.
PDMS microfluidic devices were prepared by mixing a 2-component Sylgard 184 silicone elastomer and curing agent (G A Lindberg) in a 10:1 ratio and degassing to remove bubbles. The mixture was poured onto the master mould and cured at 80 °C for >1 h. After curing, using a 1 mm biopsy tool, inlets were punched at the three points indicated by inward pointing arrows (Extended Data Fig. 4a). Using a 3 mm biopsy tool, outlets were punched at the circles (Extended Data Fig. 4a), indicating the common waste outlet and the 10 mm mark along the primary observation channel. After washing with IPA, the moulded PDMS and coverslip contact surfaces were etched in nitrogen plasma for 10 s and bonded by placing the moulded PDMS onto the coverslip. Immediately, the device was wetted and then incubated for >1 h in imaging buffer (0.22 µm filtered 25 mM HEPES, pH 7, 200 mM NaCl, 5 mM MgCl2) with 1 mg ml−1 of 1:10,000 PLL-g-PEG-biotin (3.4 kDa PEG):PLL-g-PEG (2 kDa PEG). The device was visually inspected via white light transmission microscopy at 20× magnification for defects and then stored at room temperature in imaging buffer.
Before use, the devices were washed by aspirating from the common waste outlet and filling the observation channel outlet with imaging buffer. The device channels were then incubated in imaging buffer containing 20 nM streptavidin (Merck) for at least 10 min. Cut glass slides were glued to the ends of the coverslip using a two-component dental cement (Abberior Instruments) (Extended Data Fig. 4b). Immediately before imaging, 0.2 mg ml−1 TROLOX (Merck) was added to the imaging buffer, which was bubbled with nitrogen for 15 min to remove dissolved oxygen.
The microfluidic system was prepared by washing all microfluidic lines and flow meters with chlorine followed by Milli-Q water and then IPA followed by Milli-Q water. The cleaned microfluidic system was loaded with three 2 ml reservoirs of imaging buffer containing 2 mg ml−1 TROLOX (Merck) and either:
-
1.
0.5 mM Trp, 0.2 mM CoCl2
-
2.
0.2 mM CoCl2, 1 mM SAM
-
3.
1 mM SAM, 0.5 mM Trp.
For each control experiment, the microfluidic system was loaded with two reservoirs containing the same ligand-pair solution, and the third reservoir containing imaging buffer and 2 mg ml−1 TROLOX without ligands.
Finally, the device was connected to the microfluidic system via the three 1 mm inlets and rinsed for 1 min with running flows set to 7 µl min−1 for the solution desired in the observation channel and 1 µl min−1 for the two alternate solutions.
Single-molecule fluorescence imaging was performed using a Nikon-TI2 inverted optical microscope in TIRF mode. A 100× TIRF objective (Plan-APOCHROMAT 100× 1.45 NA Oil, Nikon) was used to collect fluorescence onto an sCMOS camera (Prime 95B, Photometrics), yielding a pixel size of 110 nm. Alternating laser excitation was provided by a laser combiner (LightHUB Ultra, Omicron) equipped with an acousto-optic tunable filter triggered by the camera digital trigger out via a multifunction I/O device (PCIe-6323, National Instruments). For excitation of Alexa Fluor 488, ATTO565 and ATTO647N laser excitation was alternated between 488 nm, 561 nm and 640 nm at intensities on the order of 100 W cm−2, 50 ms exposure time per excitation wavelength producing 3 camera frames with no time delay between wavelengths. A time sequence was generated by repeating this every 700 ms. Simultaneous imaging of two emission wavelength bands on two halves of the camera sensor was achieved using an image splitter (Optosplit II, Cairn). Two sets of filter combinations (Chroma) were used: for simultaneous imaging of Alexa Fluor 488 emission and combined ATTO565 and ATTO647N emission, a ZT543rdc dichroic with ET570LP and ET525/50m emission filters; and for simultaneous imaging of ATTO565 emission and ATTO647N emission, a ZT633rdc dichroic with ET600/50m and ET700/75m emission filters.
In situ on the microscope, both outlets were emptied by aspirating. A 200 µl mixture of 1 nM TW and 200 pM DNA track was prepared at room temperature and immediately pipetted into the observation channel outlet. All flows were set to 0.5 µl min−1 and a rolled kimwipe tissue paper (Kimtech) inserted into the common waste outlet to wick away waste buffer. The surface density of reagents was observed in the observation channel approximately 1 mm away from the intersection. Once single molecule binding on the surface began to reach approximately 1 µm−2, the flows were set to operating values of 7 µl min−1 and 1 µl min−1, and the tissue was removed. An unexposed field of view was selected, and the experiment was started. During the experiment, the solution present in the main observation channel was driven with 7 µl min−1, and the alternate solutions at 1 µl min−1. Solutions were changed every 7 s following the patterns indicated in Figs. 4d–f and 5d–f and Supplementary Figs. 5c, 6c and 7c.
Single-molecule FRET analysis
The pixel coordinates of bright spots (Supplementary Fig. 9), independent of time point and colour channel, were found using the scikit-image package74. For each colour channel, a maximum intensity, I, projection over time was calculated and normalized with
$${I}_{\mathrm{norm}}=\frac{I-\min \left(I\right)}{\max \left(I-\min \left(I\right)\right)}.$$
(4)
From this image, a scale-space volume is generated by computing the Laplacian of Gaussian filtered image with successively increasing standard deviation and generating a stack of images from the result. Single particles were detected using the local maxima in this scale-space volume75. Detections close to the edges (35 pixels) of the field of view were removed.
The list of detected coordinate centres was filtered to include only detections that exhibited co-localization between the TW donor and DNA acceptor FRET channels (Supplementary Fig. 9). First, the nearest-neighbour pairs with one member in the donor channel and one in the FRET channel were identified. Co-localizing detections were determined as nearest neighbours closer than 330 nm (3 pixels) of each other to allow for localization uncertainty, alignment of the optosplit and chromatic aberration.
For each identified co-localization, a background subtracted intensity trace over time was extracted from the full unnormalized image sequence by calculating each frame as the average intensity of the pixels within a radius of 3 pixels (Supplementary Fig. 10a) minus the median of the intensities in the pixels a radius of 4 pixels away (Supplementary Fig. 10b). Doing this for each frame and channel resulted in the traces shown in Supplementary Fig. 11. These traces were matched to the ligand solution in the observation channel at the time of the image acquisition by comparing start elapsed times from the pump log and the image metadata. Any trace where the intensity of the first frame was either 2.5 times greater than or 0.2 times less than the average single fluorophore intensity was considered a spurious detection (for example, aggregates or unidentified debris) and removed from the analysis. A total of 1,860 particles were detected in Experiment 1, and 2,678 in Experiment 2. Out of these, 440 and 322, respectively, were determined to co-localize with DNA tracks. From these, 322 and 236 traces (Figs. 4g and 5g, respectively) were determined to be 1:1 TW:DNA complexes based on their fluorescence intensity.
Traces were sorted based on the last detected falling edge in either colour channel. Edges (Supplementary Fig. 12a) were determined by Gaussian filtering with a standard deviation of 1.2 (Supplementary Fig. 12b) and taking the first derivative (Supplementary Fig. 12c). Peaks and troughs were identified using sci-pys peakfinder76 using a threshold of 0.3 (Supplementary Fig. 12c). Each trace was then normalized between its max value as 1 and the average value of the final 15 frames of the trace as 0. Normalized traces were mapped to colours. In Experiment 1, 24-bit RGB colour mapping was used with acceptor intensity represented by magenta and donor intensity by green (Fig. 4g). In Experiment 2, CMYK colour space mapping was used with ATTO647N acceptor intensity represented by magenta and ATTO565 acceptor intensity represented by cyan (Fig. 5g).
Thresholding of the normalized intensity traces was used to determine the time which TW spent either bound to the intended (adjacent) trpR site or bound to the non-adjacent trpR site farthest from the bound foot. Owing to the differing FRET efficiencies of the two fluorophores, independently selected absolute thresholds were used, specifically 0.8 for ATTO647N FRET and 0.5 for ATTO565 FRET. Frames were counted as intended binding if the only the corresponding intensity exceeded the threshold: ATTO647N in the first buffer and ATTO565 in the third. Otherwise, frames were counted as non-adjacent binding including frames in which neither or both FRET intensities exceeded the threshold. To include an equal amount of data from each ligand solution, only the first three solution conditions were included in the analysis and only traces where the protein remained co-localized with the DNA for the full duration of this period were included. The fraction of time spent in the intended binding sites was calculated as \({t}_{\text{intended}}/({t}_{{\text{intended}}}+{t}_{{\text{unintended}}})\) for each trace resulting in a mean of 65% ± 7.7%, while the fraction of time spent in the unintended binding sites was calculated as \({t}_{{{\mathrm{unintended}}}}/({t}_{{{\mathrm{intended}}}}+{t}_{{{\mathrm{unintended}}}})\) for each trace resulting in a mean of 35% ± 6.3% where limits are 95% confidence intervals.
Statistics and reproducibility
All experiments were conducted with at least three independent replicates. No statistical method was used to predetermine sample size. The experiments were not randomized and the investigators were not blinded to allocation during experiments and outcome assessment.