
Transcriptomic restoration is a hallmark of drug-resistant cancer cells
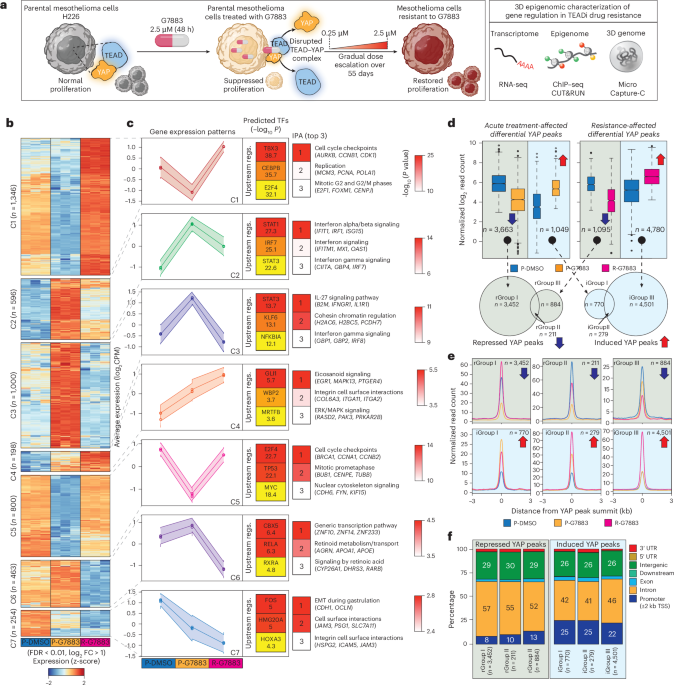
To define transcriptional changes associated with drug response and resistance, we performed bulk RNA sequencing (RNA-seq) on mesothelioma H226 cells under three scenarios: (1) parental cells treated with vehicle (dimethyl sulfoxide; P-DMSO), (2) parental cells acutely treated (48 h) with pan-TEADi GNE-7883 (P-G7883) and (3) cells made resistant to GNE-7883 (R-G7883) through continuous exposure to increasing concentrations of the inhibitor. Briefly, parental H226 cells were subjected to gradual dose escalation from 0.25 µM to 2.5 µM over 55 days, allowing recovery and outgrowth of persister populations under sustained drug pressure, as previously described37 (Methods and Fig. 1a).

a, Experimental workflow. Parental H226 mesothelioma cells were treated with the pan-TEADi GNE-7883 (G7883; 2.5 μM, 48 h), resulting in suppressed proliferation and disruption of the YAP–TEAD complex. Gradual dose escalation (0.25–2.5 μM over 55 days) generated resistant cells with restored proliferation37. Cells from parental, acutely treated and resistant states were profiled by RNA-seq, ChIP–seq, CUT&RUN and MCC. b, Heatmap of differentially expressed genes (FDR < 0.01, log2FC > 1, n = 3; n = 4,657) grouped by k-means clustering. c, Average gene expression profiles for each cluster (left). Top three upstream regulators predicted by IPA are shown with enrichment significance (–log10-transformed P values; right-tailed Fisher’s exact test, no additional multiple-testing correction) in the inner heatmaps (middle). The top three enriched biological pathways with representative genes are shown (right). d, Differential YAP binding across conditions (FDR < 0.01). Box plots show normalized read counts; boxes indicate the interquartile range (IQR), center lines the median, and whiskers extend to 1.5× IQR. Arrows denote decreased or increased YAP occupancy. Venn diagrams show overlap of peaks with decreased or increased occupancy, defining six binding groups. e, Aggregate profiles of normalized read enrichment centered on YAP peak summits for each binding group. f, Genomic annotation of YAP peaks across binding groups, shown as percentages of total peaks. Regs., regulators; UTR, untranslated region. Panel a created in BioRender; Daniel, B. https://biorender.com/gicmylv (2026).
Across all conditions, we detected 4,657 differentially expressed genes (false discovery rate (FDR) < 0.01, log2(fold change (FC)) > 1), which could be grouped according to seven distinct transcriptional patterns (C1–C7; Fig. 1b and Supplementary Table 1). These clusters defined distinct responses to acute treatment and resistance.
C1 and C5 included genes that were downregulated upon acute GNE-7883 treatment but whose expression either returned to the levels in parental cells (C5, n = 800) or exceeded them (C1, n = 1,346) in the resistant state. These clusters therefore reflected transcriptional recovery and overcompensation. Upstream regulator analysis using Ingenuity Pathway Analysis (IPA) predicted cell cycle TFs (for example, E2F and MYC) and enrichment of cell cycle pathways (for example, replication)38,39 (Fig. 1c and Supplementary Table 2). C2 and C3 included genes induced upon acute inhibitor treatment. In C2 (n = 596), expression remained elevated in resistant cells, whereas in C3 (n = 1,000), expression returned to baseline. These clusters therefore captured sustained versus transient induction and were associated with inflammatory TFs (for example, STATs and IRFs) and interferon-driven inflammatory pathways40,41.
Genes in C4, the smallest cluster (n = 198), showed de novo activation, with low or no expression in parental cells and progressive upregulation, with expression peaking in resistant cells. Predicted regulators included TFs involved in proliferation and differentiation (for example, GLI1 and WBP2), with enrichment of integrin cell surface interactions and ERK/MAPK signaling42,43. C6 and C7 showed reduced expression compared to parental cells. In C6 (n = 463), repression was specific to resistant cells, whereas in C7 (n = 254), repression occurred upon acute treatment and was further enhanced in resistant cells. These clusters thus represented progressive repression across conditions and included predicted regulators of CBX5, RXRA, FOS and HOX, as well as SNAI2, which is a regulator of integrin and cadherin genes and of epithelial–mesenchymal transition, the top pathway in C744.
To assess conservation of these patterns, we performed RNA-seq in a second mesothelioma cell model (MSTO; Methods), identifying 7 clusters (differential genes; n = 4,216) across the same conditions (P-DMSO, P-G7883 and R-G7883) (Extended Data Fig. 1a and Supplementary Table 3). We then compared clusters across models to identify shared programs. Overlap analysis focused on genes that recovered after acute treatment or gained activity in resistant cells (Extended Data Fig. 1b). Clusters with shared programs included H226 C1 and MSTO C5 (n = 80), which showed transient repression followed by strong recovery or increased expression in resistance; and H226 C5 and MSTO C5 (n = 102), which showed full recovery after acute repression. These conserved programs indicate common recovery mechanisms and were enriched for RAF/MAPK, cell cycle and Hippo signaling (Extended Data Fig. 1c).
Together, these data define transcriptional responses to acute pan-TEADi treatment and resistance. Resistant cells adopt a distinct state dominated by restoration toward a parental-like transcriptional program, with a smaller contribution from de novo gene activation.
Restoration and extension of the YAP cistrome in drug resistance
GNE-7883 functions by displacing YAP, a key cofactor of TEAD, from chromatin-bound TEAD26. To define how YAP chromatin binding changed during acute treatment and resistance, we performed YAP chromatin immunoprecipitation followed by sequencing (ChIP–seq) and differential binding analysis in both models (FDR < 0.01, log2FC > 1), comparing (1) P-DMSO versus P-G7883 and (2) P-DMSO versus R-G7883. These analyses identified widespread remodeling of YAP occupancy in both acute treatment and resistance conditions. Acute treatment resulted in peaks with decreased and increased YAP occupancy (H226 decreased: n = 3,663; increased: n = 1,049; MSTO decreased: n = 16,196; increased: n = 1,990), whereas resistance showed a distinct pattern with substantial gain of YAP binding sites (H226 decreased: n = 1,095; increased: n = 4,780; MSTO decreased: n = 17,080; increased: n = 8,658; Fig. 1d, top, and Extended Data Fig. 1d,e).
To define shared and condition-specific binding events, we overlapped peaks with increased YAP occupancy (iGroups I–III) and peaks with decreased YAP occupancy (rGroups I–III) across the two comparisons within each model (Fig. 1d, bottom, and Extended Data Fig. 1d,e). This classification distinguished peaks affected by acute treatment (rGroup I and iGroup I), resistance (rGroup III and iGroup III) or both (rGroup II and iGroup II). In MSTO cells, rGroup I peaks (n = 9,839; Extended Data Fig. 1e) showed decreased YAP occupancy upon acute treatment, followed by restoration to parental levels in resistant cells. By contrast, H226 rGroup I peaks (n = 3,452, Fig. 1e) exhibited restoration and a further increase in YAP occupancy in resistance, whereas rGroups II (H226: n = 211; MSTO: n = 6,357) and III (H226: n = 884; MSTO: n = 10,723) showed reduced YAP occupancy upon both acute treatment and resistance, and all iGroups displayed elevated YAP occupancy relative to control parental cells (Fig.1e and Extended Data Fig. 1e).
Motif analysis of peaks with increased YAP occupancy (iGroups I–III) revealed enrichment for CEBP, AP-1, NF-κB and RUNX TF motifs, whereas peaks with decreased YAP occupancy (rGroups I–III) were enriched for TEAD and AP-1 TF motifs in both models (Extended Data Fig. 1d,e). Peaks with increased YAP occupancy, either upon acute treatment or in resistance, were approximately twice as likely as peaks with decreased occupancy to localize to promoter proximal regions (±2 kb from transcription start sites (TSSs); Fig. 1f and Extended Data Fig. 1f), indicating a shift toward promoter-associated YAP binding in resistance.
To determine whether restoration of YAP occupancy in resistant cells was driven by changes in gene dosage, we assessed YAP1 copy number by DNA fluorescence in situ hybridization (FISH). No change in YAP1 copy number was observed in resistant H226 cells despite expansion of the YAP1 cistrome, whereas resistant MSTO cells exhibited an approximately three-fold increase in YAP1 copy number (Extended Data Fig. 1g).
Together, these results demonstrate that both models restore and expand the YAP cistrome with a promoter-biased binding profile in resistance, independent of YAP1 copy number status.
Dysregulated RE–P interaction networks in resistant cells
Having established that transcriptional programs and YAP binding were restored or extended in resistant cells, we next considered whether RE–P interactions were similarly affected. To address this, we performed high-resolution genome conformation mapping via MCC in both models and designed model-specific hybrid capture probes targeting promoters of TEAD target genes validated by YAP/TAZ or pan-TEAD (TEAD1–4) perturbations in parental H226 cells (Extended Data Fig. 2a, right). Capture probes included promoters of genes showing restored or increased expression in resistant cells, as well as control genes with reduced expression in resistance (H226 n = 40 and MSTO n = 50; Fig. 2a,d and Supplementary Table 4).

a, Heatmap of gene expression (z-scores) for MCC-selected genes in H226 cells (n = 40) across parental (P-DMSO), acutely TEAD-inhibited (P-G7883) and resistant (R-G7883) conditions. b, Aggregated read-density plots and heatmaps showing normalized MCC contacts (left) and YAP ChIP–seq signal (right) centered on MCC peak summits (n = 543). c, Genomic annotation of H226 MCC peaks and their overlap with YAP, CTCF and promoter sites; ‘other’ indicates overlap with ATAC-seq peaks only (top). Motif enrichment is also shown (bottom). d, Heatmap of MCC target gene expression (z-scores) in MSTO cells (n = 50) across the same conditions. e, Aggregate MCC and YAP read-density profiles at MSTO MCC peaks (n = 1,838). f, Genomic annotation and motif enrichment of MSTO MCC peaks as in c. Motif enrichment was performed using HOMER (hypergeometric test, one-sided; no additional multiple-testing correction). Bckg., background; prom., promoter.
First, we examined read coverage at targeted gene promoters and observed similar signals across conditions, indicating comparable capture efficiency (Extended Data Fig. 2b). We next analyzed read coverage at REs interacting with the captured promoters that overlapped with open chromatin regions defined by assay for transposase-accessible chromatin using sequencing (ATAC-seq) (peak calling, Methods). This identified 543 RE peaks interacting with 40 promoters in H226 cells and 1,838 peaks interacting with 50 gene promoters in MSTO cells. Despite similar promoter capture efficiency, the average MCC signal at these interacting REs was comparable between parental and acutely treated cells but significantly reduced in the resistant state in both models (Wilcoxon rank-sum test, P < 0.05; Fig. 2b,e and Extended Data Fig. 2b). However, YAP binding dynamics at these REs differed between models. In H226 resistant cells, YAP occupancy was increased relative to parental cells, whereas in MSTO cells, YAP occupancy remained reduced in the resistant state compared to parental cells (Fig. 2b,e).
Annotation of MCC peaks showed that captured promoters primarily interacted with YAP-bound regions, gene promoters, CTCF sites and other open chromatin regions defined by ATAC-seq (Fig. 2c,f, top). Motif enrichment analysis revealed AP-1 and CTCF motifs in both models and a T-box motif specifically in MSTO cells (Fig. 2c,f, bottom). To determine whether these interaction changes were accompanied by altered promoter activity, we quantified promoter activity using bulk RNA-seq-based inference of promoter-initiated transcript levels45. Across the genome, we identified promoters with differential activity between parental and resistant cells, including 794 with decreased activity and 578 with increased activity in resistant H226 cells, and 376 with decreased activity and 632 with increased activity in resistant MSTO cells (local false sign rate ≤ 0.10) (Extended Data Fig. 2c and Supplementary Table 5). Among MCC-targeted promoters, 13 showed increased activity in resistant H226 cells (for example, VIM, CD44, SKP2), and 10 showed increased activity in resistant MSTO cells (for example, TACC3, FOSL1, RGS4) (Extended Data Fig. 2d), whereas most promoters exhibited full or partial recovery of activity in both models.
Together, these results indicate that reduced RE–P interaction strength coincides with restored or increased promoter activity at selected loci, consistent with a shift in regulatory logic in resistant cells toward reduced dependence on RE–P interactions for gene expression recovery.
Enhancers become dispensable for transcriptional regulation in resistance
To test whether distal REs that lost promoter interactions in the resistant state remained enhancers of gene expression, we used paired CRISPR guides to delete selected REs and promoters in both cell line models. Target regions were chosen based on loss or reduction of RE–P interactions detected by MCC in resistant cells. Using this strategy, we perturbed REs or promoters at the FOSL1 and TACC3 loci in both models; CCN1, CDK2 and ANKRD1 in H226; and RGS4 and PRCP-associated REs in MSTO, with the expectation that RE ablation would show diminished effects on gene expression in resistant cells.
At the FOSL1 locus, we targeted a −15-kb RE that interacted with the promoter in parental cells but lost this interaction in resistance, despite restored YAP binding in H226 and reduced YAP binding in MSTO (Fig. 3a,d). Deletion of this RE reduced FOSL1 expression in both parental models but had only marginal effects in resistant cells, whereas promoter perturbation reduced expression in both parental and resistant states. Similar behavior was observed at the CCN1 and CDK2 loci in H226 cells (Extended Data Fig. 3a,b): in parental cells, CCN1 depended on a −2.2-kb RE (overlapping with the DDAH1 promoter) and CDK2 on an intronic −10-kb RE, but these dependencies were diminished or lost in resistance.

a–c, Genome browser tracks visualizing MCC, YAP and CTCF ChIP–seq signals in the indicated conditions at the FOSL1 (a), TACC3 (b) and ANKRD1 (c) loci from H226 cells. d–f, Genome browser tracks visualizing MCC, YAP and CTCF CUT&Tag53 signals in the indicated conditions at the FOSL1 (d), TACC3 (e) and RGS4 (f) loci from MSTO cells. CRISPR perturbation loci are highlighted by yellow shaded regions, and viewpoint regions are represented by asterisks. Box plots represent ACTB-normalized mRNA levels for genes in the indicated conditions following CRISPR deletion. The box represents the IQR, the internal line represents the average of the data, and whiskers extend to the smallest and largest values. Significant differences were determined by two-tailed, unpaired t-tests at P < 0.05; n = 4 (two biological and two technical replicates were performed for each editing experiment).
We next examined the TACC3 locus, which showed reduced RE–P interactions in both models but distinct architectures. In H226, we perturbed two REs: a −27 kb CTCF-overlapping site that lost interaction in resistant cells and a −9.2 kb site (the SLBP promoter) that retained partial interaction (Fig. 3b). All perturbations reduced TACC3 expression in parental cells. In resistant H226 cells, the −27-kb RE became dispensable, whereas the −9.2-kb RE remained essential. In MSTO cells, in which no strong −27-kb interaction was detected, we targeted only the −9.2-kb RE and the promoter; although this RE retained function in resistant H226 cells, it became dispensable in resistant MSTO cells (Fig. 3e). Further, at the RGS4 locus in MSTO, two long-range REs (−214 kb CTCF and −212 kb YAP–CTCF co-occupied sites) were required for expression in parental cells but became dispensable in resistance (Fig. 3f).
We also analyzed loci in which RE–P interactions were reduced after acute treatment but exhibited signs of restoration in resistance. In H226 cells, perturbation of an intergenic −9.8-kb RE at the ANKRD1 locus reduced expression in both parental and resistant cells, as did perturbation of the promoter (Fig. 3c). Similarly, in MSTO cells, deletion of a −183 kb CTCF site interacting with the ‘shared’ promoter of PRCP and DDIAS reduced expression of both genes in parental and resistant states (Extended Data Fig. 3c).
Finally, to assess residual enhancer activity after acute treatment, we perturbed the FOSL1 promoter and −15-kb RE under acute GNE-7883 exposure. Although acute treatment reduced FOSL1 expression, promoter deletion did not further decrease expression in either model. Deletion of the −15-kb RE caused a small additional decrease in H226 but had no effect in MSTO (Extended Data Fig. 3d).
Together, these perturbation experiments demonstrate that multiple genes recover or maintain expression in resistant cells despite reduced distal RE function, supporting a shift toward promoter-reinforced regulatory control.
Resistance-induced FOSL1 exhibits promoter-biased binding profile in the genome
To identify gene regulatory mechanisms by which GNE-7883-resistant cells might circumvent the observed loss of RE–P interactions, we focused on TFs that gained activity in the resistant state of H226 cells. Recent research has identified AP-1 family member FOSL1 as a critical TF in the resistant state that is essential for maintaining cell proliferation37. First, we assessed copy number variation with DNA FISH in parental and resistant cells and did not observe copy number differences for FOSL1 (Extended Data Fig. 4a). Second, we performed ChIP–seq for FOSL1 to understand how the FOSL1 cistrome was remodeled in resistant cells. This analysis identified FOSL1 binding sites that were specific to acute inhibitor treatment (‘acute’), resistance (‘resistant’) or both (‘common’) (FDR < 0.01, log2FC > 1; Extended Data Fig. 4b).
Notably, FOSL1 sites that were gained in resistant cells (n = 3,037) or by acute treatment and maintained in the resistant state (n = 92) were more enriched in the vicinity of gene promoters than any other FOSL1 peak group (for example, 44% in ‘common’ and ‘resistant’ versus 11% ‘acute’; Extended Data Fig. 4c). Further analysis of the resistance-specific gained FOSL1 sites revealed strong enrichment of promoter-specific TF motifs (for example, GFY, NFY, SP/KLF), whereas FOSL1 sites decreased in resistance were enriched for AP-1 and TEAD motifs (Extended Data Fig. 4d).
These findings demonstrate that resistance-induced FOSL1 exhibits a promoter-biased binding profile and suggests that some of the resistance-specific TFs might preferentially operate from gene promoters to recover gene expression in resistance.
TF network of TEADi-resistant mesothelioma cells
We then used Ingenuity’s upstream regulator analysis to predict TFs that could regulate gene expression in resistant H226 cells. Using genes that were specifically induced, or restored in the resistant state, IPA upstream regulator analysis identified TFs whose known targets were significantly enriched among these gene sets (Extended Data Fig. 5a). Next, to identify the most relevant TFs that governed the resistant state, we used TFCheckpoint46, a database of transcriptional regulators, and overlaid its members with genes that exhibited resistance-restored or resistance-induced expression compared to parental control cells (RNA-seq C1, C4 and C5; Fig. 1b). This analysis identified 203 potential transcriptional regulators (Extended Data Fig. 5b and Supplementary Table 6). By taking the intersection of the predicted upstream regulators with this TF gene list, we identified 22 TFs with potential roles in governing resistance-specific gene expression, including FOSL137, KLF4 and ETV4 (Extended Data Fig. 5c).
The above results and the fact that KLF TFs could bind the promoter-specific SP/KLF motif (that is, the GC-box), motivated us to further evaluate the roles of KLF4 in resistance. We first determined KLF4 copy numbers and found no difference between parental and resistant cells by DNA FISH (Extended Data Fig. 5d). Next, we mapped the binding sites of KLF4 by ChIP–seq with the expectation that KLF4 would show a largely resistance-specific binding profile based on its expression pattern; nonetheless, we detected a similar number of KLF4 peaks that were lost (n = 1,345) and gained (n = 1,149) in resistance (FDR < 0.01). No acute GNE-7883 treatment induced changes were detected. Notably, resistance-specific KLF4 peaks exhibited promoter-biased binding profiles compared to the ones that were weaker in the resistant state (decreased 7% versus gained 21%), with enrichment for the promoter-specific SP/KLF motif; however, most KLF4 peaks were found at intronic and intergenic locations (Extended Data Fig. 5e,f).
Overall, these data identify a TF network of resistance and indicate that TFs including KLF4 are potential regulators of the resistant state in H226 cells.
Promoter-centered regulation accompanies transcriptional recovery in resistance
To obtain an integrated view of the regulatory landscape at target promoters and their interacting REs, we combined transcriptomic and epigenomic datasets in the H226 model (Fig. 4 and Extended Data Fig. 6). MCC analysis revealed that target genes engaged variable numbers of promoter-associated chromatin interactions (Extended Data Fig. 6a). Across this set, gene expression and promoter activity showed highly concordant patterns, indicating that promoters remained transcriptionally active in resistant cells even when distal RE function was compromised (Fig. 4a,b). By contrast, genes repressed in resistance (for example, CTH, IGF1R and SAA1) exhibited reduced promoter activity.

a,b, Heatmaps of RNA expression (a) and inferred promoter activity (b; from bulk RNA-seq45) for MCC target genes (n = 40) across P-DMSO, P-G7883 and R-G7883 H226 cells (z-score). c,d, Heatmaps of CPM-normalized signal (z-score) at (c) MCC-targeted promoters for FOSL1, KLF4, H3K4me3, p300 and H3K27ac and (d) MCC-linked distal REs for MCC interaction frequency, TEAD1, YAP, p300 and H3K27ac occupancy (ChIP–seq or CUT&RUN). e,f, Violin plots of normalized read counts at promoters (e) and REs (f). Center lines indicate medians, distributions reflect data density and overlaid boxes show IQR with whiskers extending to 1.5× IQR. Statistical significance was assessed using a two-sided Wilcoxon rank-sum test (P < 0.05; n = 2 biological replicates). g, Genome browser tracks of representative loci. Blue shading marks promoters (asterisks); yellow shading marks MCC-linked REs. ND, not detected.
Analysis of promoter-associated features revealed gene-specific and variable FOSL1 binding, whereas KLF4 occupancy increased at most target promoters in resistant cells (Fig. 4c,e). Promoter-associated histone 3 K4 trimethylation (H3K4me3) was reduced following acute GNE-7883 treatment but restored in resistance, whereas p300 and histone 3 K27 acetylation (H3K27ac) were suppressed by acute treatment and failed to fully recover, indicating incomplete restoration of histone acetyltransferase (HAT) activity at promoters (Fig. 4c and Extended Data Fig. 6d). TEAD1 and YAP occupancy displayed transient repression followed by restoration, and increased chromatin accessibility at most promoters in the resistant state, consistent with recovered promoter activity (Extended Data Fig. 6b). Resistance-repressed genes showed weaker or no acquisition of these features, except for partial recovery of TEAD1 and YAP binding (Fig. 4a–d).
At MCC-linked REs, interaction frequencies were broadly reduced in resistance and accompanied by near-complete restoration of TEAD1 binding, increased YAP and KLF4 occupancy, and enhanced chromatin accessibility; however, p300 and H3K27ac showed minimal recovery (Fig. 4d,f and Extended Data Fig. 6b,c,d), indicating that these regions did not fully regain enhancer activity. At representative loci (FOSL1, SKP2 and FAM216A; Fig. 4g), reduced RE–P contacts coincided with promoter-proximal gains in KLF4 and FOSL1 binding and restored H3K4me3, despite diminished p300 and H3K27ac. By contrast, IGF1R, which was repressed by acute treatment and failed to recover in resistance, lacked promoter KLF4 or FOSL1 binding, showed no restoration of H3K4me3 or H3K27ac, and exhibited weakened distal RE interactions (Extended Data Fig. 6e).
Collectively, the results of this integrative analysis demonstrate that chronic TEAD inhibition reshapes regulatory architecture by limiting enhancer-associated acetylation and long-range chromatin looping, while enabling promoters to regain transcriptional activity marked by restored H3K4me3.
Enhanced chromatin opening despite impaired HAT activity in resistance
To extend our promoter-centric findings from MCC-targeted genes, we next investigated global changes in chromatin accessibility to determine how resistant cells remodeled their RE landscape under sustained TEAD inhibition. ATAC-seq profiling of the H226 model revealed widespread chromatin alterations in resistant cells compared to parental cells (FDR < 0.01, log2FC > 0.5). We detected 16,212 opening and 5,737 closing ATAC regions in resistance, consistent with globally increased chromatin remodeling activity (Extended Data Fig. 7a,b). At closing regions, we observed marked loss of p300 and H3K27ac, consistent with enhancer decommissioning. By contrast, at opening regions, globally, p300 occupancy (which was reduced after acute GNE-7883 treatment) was restored in resistance, whereas H3K27ac showed only weak recovery (Extended Data Fig. 7a,b). Annotation of differential ATAC regions showed nearly three-fold more enrichment of promoter-proximal sites among opening regions, further highlighting promoters as major REs of recovery in resistance (Extended Data Fig. 7c). Motif analysis reinforced this distinction: closing regions were enriched for enhancer-associated motifs such as GATA, TEAD and NF1, whereas opening regions were enriched for AP-1, ETS, and promoter-associated NFY and SP/KLF motifs (Extended Data Fig. 7d,e).
Together, these findings suggest a genome-wide adaptation strategy in which TEADi-resistant cells increase chromatin remodeling activity to sustain transcription under conditions of reduced HAT function and weakened RE–P interactions, establishing a promoter-centric mode of transcriptional control.
KLF4 regulates promoter-centric gene expression and growth in resistant cells
To further investigate promoter-dependent mechanisms that restored gene expression in resistant H226 cells, we quantified promoter activity by measuring promoter-derived transcripts using real-time quantitative PCR (RT–qPCR). Primers were designed to capture divergent transcription upstream of active TSSs47. We assessed promoter transcripts and mRNA levels for FOSL1, VIM, CDK2 and CCN1 in parental and resistant cells (Fig. 5a and Extended Data Fig. 8a). For all four genes, promoter activity was elevated in the resistant state, accompanied by enhanced or restored mRNA expression.

a, Bar plots showing ACTB-normalized mRNA and promoter transcript levels for FOSL1, VIM and CDK2. Data are presented as mean ± s.d.; significance was assessed by two-tailed unpaired t-tests (P < 0.05; n = 3 biological replicates). b, Heatmap of ACTB-normalized mRNA levels for the indicated genes (n = 20) following KLF4 knockdown in parental and resistant cells (qPCR; two-tailed unpaired t-test, P < 0.05; n = 2 biological replicates). c, Box plots showing KLF4 ChIP–qPCR enrichment at the indicated gene promoters. Boxes represent the IQR, the center line indicates the median, and whiskers extend to the minimum and maximum values; all data points are shown. Significance was assessed by two-tailed unpaired t-tests (P < 0.05; n = 4; two biological replicates with two technical replicates each). Gauge plots show ACTB-normalized promoter transcript levels in resistant cells under control and KLF4 knockdown conditions, relative to control (nontargeting guide). Pins indicate mean values, and shaded regions indicate ±s.d. across replicates. Percentage values indicate reduction relative to control (two-tailed unpaired t-test, P < 0.05; n = 4; two biological replicates with two technical replicates each). d, Real-time live-cell measurements of parental (left) and GNE-7883-resistant (right) cells following KLF4 (red) or control (blue) knockdown over 7 days. Lines represent mean confluency and shaded areas indicate ±s.d. (n = 6 biological replicates). e, Model of promoter reinforcement in TEADi resistance. In parental cells, distal REs contact promoters and support gene expression. Acute TEAD inhibition disrupts YAP binding and enhancer acetylation and weakens RE–P interactions. In resistant cells, RE–P contacts are further reduced, distal REs lose functional contribution and promoters regain activity, as marked by restoration of H3K4me3 and recruitment of TFs such as KLF4, enabling promoter-centered gene expression despite incomplete enhancer reactivation. CTR, control; KD, knockdown; norm., normalized; pRNA, promoter-associated RNA. Panel e created in BioRender; Daniel, B. https://biorender.com/gicmylv (2026).
We next tested the functional roles of TFs induced in resistance by CRISPR-mediated knockdown of FOSL1, KLF4 and ETV4 in parental and resistant cells (RT–qPCR; Extended Data Fig. 8b). Whereas perturbation of each TF affected expression of a subset of TEAD target genes examined by MCC, KLF4 depletion uniquely reduced expression of all 20 measured genes in a resistance-specific manner (unpaired two-tailed t-test, P < 0.05; Fig. 5b and Extended Data Fig. 8c). These experiments also revealed a hierarchical relationship in which KLF4 maintains resistance-specific expression of FOSL1 and ETV4, whereas FOSL1 and ETV4 have minimal impact on KLF4 expression. Consistent with these results, ChIP–qPCR confirmed resistance-induced enrichment of KLF4 at the promoters of FOSL1, VIM, CDK2 and CCN1 (Fig. 5c and Extended Data Fig. 8d). In addition, KLF4 knockdown reduced promoter transcript levels at all four loci by >50% in resistant cells, validating its role in sustaining promoter activity (Fig. 5c and Extended Data Fig. 8d). Finally, loss of KLF4 significantly impaired proliferation of resistant cells, whereas parental cell proliferation was not affected (Fig. 5d).
Taken together, these data support a model in which TEADi-resistant cells rely on promoter-centric gene regulation, driven in part by KLF4, to sustain gene expression despite the loss of RE–P interactions (Fig. 5e).